PHYSICAL AND CHEMICAL PROPERTIES
We try to keep CO2 levels in our U.S. Navy submarines no higher than 8,000 parts per million, about 20 time current atmospheric levels. Few adverse effects are observed at even higher levels. – Senate testimony of Dr. William Happer, here
CO is a colorless, odorless gas (Budavari et al. 1989). Selected physical and chemical properties are summarized in Table 4-1.
OCCURRENCE
CO primarily is produced by partial oxidation of
carbon-containing materials (Pierantozzi 1995). In the outdoor
environment, major sources of CO are motor vehicles and fires (EPA
2000). In the indoor environment, sources include tobacco smoking,
combustion engines, and combustion appliances, such as furnaces and gas
stoves. On submarines, the primary sources of CO are tobacco smoking,
diesel generators, and high-temperature paints (Crawl 2003). Data
collected on nine nuclear-powered ballistic missile submarines indicate
an average CO concentration of 5 parts per
TABLE 4-1 Physical and Chemical Properties of Carbon Monoxidea
Synonyms
|
Carbonic oxide, carbon oxide, flue gas
|
CAS registry number
|
630-08-0
|
Molecular formula
|
CO
|
Molecular weight
|
28.01
|
Boiling point
|
−191.5°C
|
Melting point
|
−205.0°C
|
Flash point
|
—
|
Explosive limits
|
12.5% to 74.2% (volume % in air)
|
Specific gravity
|
0.968 with respect to air
|
Vapor pressure
|
>1 atm at 20°C
|
Solubility
|
Sparingly soluble in water; appreciably soluble in ethyl acetate, chloroform, and acetic acid
|
Conversion factors
|
1 ppm = 1.15 mg/m3; 1 mg/m3 = 0.87 ppm
|
aData on vapor
pressure are from HSDB (2004); data on explosive limits are from IPCS
(2001); all other data are from Budavari et al. (1989).
Abbreviations: atm, atmosphere; mg/m3, milligram per cubic meter; ppm, parts per million; —, not available or not applicable.
|
|
million (ppm) and a range of 0-14 ppm, and data
collected on 10 nuclear-powered attack submarines indicate an average CO
concentration of 3 ppm and a range of 0-14 ppm (Hagar 2003).
SUMMARY OF TOXICITY
The toxicology of CO in humans was reviewed by
the World Health Organization (WHO) (1999), the U.S. Environmental
Protection Agency (EPA) (2000), and the NRC (2002). Only human and
animal data directly relevant to derivation of the EEGL and CEGL values
are discussed in this chapter.
CO interferes with the oxygenation of blood and
the delivery of oxygen to tissues because it has about 245 times more
affinity for hemoglobin than does oxygen (Roughton 1970). The formation
of carboxyhemoglobin (COHb) reduces the oxygen-carrying capacity of
blood and shifts the oxygen dissociation curve, reducing the release of
oxygen to tissues. Hypoxemia and subsequent tissue hypoxia comprise the
best understood mechanism of CO toxicity. The cytotoxic effects of CO
independent of oxygen are subjects of current research. CO also binds to
muscle myoglobin, cytochrome c oxidase, and cytochrome P-450, and many of the adverse effects of CO might be associated with those reactions (WHO 1999;
EPA 2000; Raub et al. 2000). Endogenous
production of CO accounts for a background COHb level of about 1%
(Radford et al. 1981; Doherty 2000). The log-log plot of CO uptake and
COHb saturation, as computed from the Coburn-Foster-Kane equation, is
shown in Figure 4-1 (Peterson and Stewart 1975).
The brain and cardiovascular system are the
primary targets of CO toxicity. The adverse effects of CO exposures
range from subtle vascular and neurologic changes to more serious
conditions, such as loss of consciousness and death. Even when
CO-intoxicated patients receive treatments, more than 10% of survivors
might experience permanent brain damage, and in many cases, the onset of
adverse effects is delayed as long as 1 week or more. The primary cause
of neurologic injury might be hypotension leading to impaired tissue
perfusion (Varon et al. 1999). CO intoxication causes hypotension by
myocardial depression, peripheral vasodilation, and ventricular
dysrhythmia (Varon et al. 1999).
Morbid complications of CO intoxication are
greatly affected by a variety of factors related to cardiovascular
health, including the degree and duration of hypotension, and the
presence of pre-existing cardiac or pulmonary disease, anemia, or
cardiac dysfunction (arrhythmias or other conditions) (Ehrich et al.
1944; Stewart et al. 1975). COHb concentrations in smokers average 4%
and range from 3% to 8%; heavy smokers could have COHb concentrations as
high as 15% (Raub et al. 2000; Omaye 2002). Submariners who smoke
theoretically might be subject to additional health risks from
environmental exposure given their already elevated COHb levels.
A number of short- and long-term adaptations to
compensate for reduced oxygenation of blood and tissues related to CO
exposure have been identified. Those changes are found in humans and
animals and include increased coronary and brain blood flow in the
short-term and increased hematopoiesis over time (WHO 1999). However,
cardiovascular disease might reduce or eliminate the body’s ability to
compensate for CO-related hypoxemia and tissue hypoxia (WHO 1999).
Effects in Humans
Accidental Exposures
In their review of U.S. mortality records from
1979-1988, Cobb and Etzel (1991) identified 56,133 (0.3%) of the total
death records (NCHS
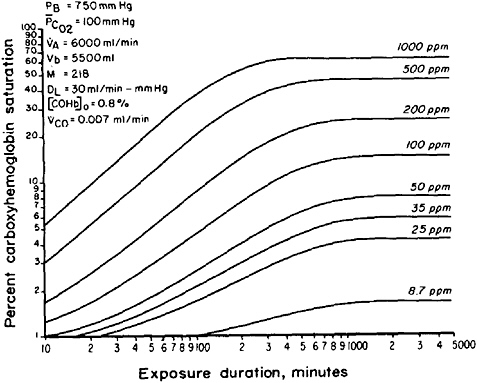
FIGURE 4-1 Carbon monoxide
concentrations reached in blood (percent saturation at various
durations of exposure) in a normal human subject as a function of
inspired CO. Abbreviations: PB, barometric pressure; PCO2, average partial pressure of carbon dioxide in lung capillaries; VA, alveolar ventilation rate; Vb, blood volume; M, equilibrium constant; DL, diffusing capacity of the lungs; [COHb]o, control value of carboxyhemoglobin prior to carbon monoxide exposure; VCO, rate of endogenous carbon monoxide production. Source: Peterson and Stewart 1975. Reprinted with permission from the Journal of Applied Physiology; copyright 1975, the American Physiology Society.
2002) that indicated CO toxicity as a
contributing cause of death. Acutely fatal CO poisoning is likely due to
hypoxia and its adverse effects on the heart, as suggested by the large
number of patients who exhibited marked hypotension and lethal
arrhythmias prior to CO-induced death.
Sokal and Kralkowska (1985) provided an analysis
of 39 patients (18-78 years of age) intoxicated by CO produced from the
combustion of household gas or coal-stove gas. Of the 39 patients
exposed to CO, 16 showed mild intoxication and 12 showed moderate
intoxication exhibiting symptoms, such as headache, vomiting,
tachycardia, and breathing problems, after exposures that lasted about 5
h. COHb concentrations averaged
27%. Eight patients presented with symptoms of
severe intoxication, including loss of consciousness and pathologic
neurologic signs, tachycardia, and tachypnea after exposures that lasted
about 9 h. COHb concentrations averaged 34%. Four subjects exhibited
very severe effects, including central nervous system (CNS) damage, and
circulatory and respiratory disturbances after exposures that lasted
about 10 h. COHb concentrations averaged 31%. The subcommittee notes the
lack of agreement between the total number of patients in the study and
the number of patients categorized by clinical degree of intoxication.
Ely et al. (1995) reported adverse effects of CO
exposures in employees of a sewing company located in a warehouse where a
propane-fueled forklift was in operation. Thirty people were exposed to
CO concentrations at up to 386 ppm. The five workers who exhibited the
most severe symptoms had an average estimated COHb concentration of 35%.
One of those workers had seizures. The majority of people exposed
reported CNS, behavioral, gastrointestinal, and cardiovascular
abnormalities, including headache (93%), dizziness (63%), nausea (60%),
chest pain (57%), difficulty breathing (23%), visual changes (20%), and
confusion (17%). Eleven of 25 patients contacted 2 years after exposure
reported seeking medical care for persistent symptoms.
Hassan et al. (2003) reported two cases of CO
poisoning that resulted in sensorineural hearing loss. The subject of
the acute poisoning case, a 30-year-old man, presented with a COHb
concentration of 29.9%. That subject showed only partial recovery from
hearing loss. A 61-year-old woman reported to have endured chronic CO
exposure presented with bilateral hearing loss that improved with time.
Overall findings indicate that CO affects high-frequency hearing (1-8
kilohertz).
Experimental Studies
The adverse clinical effects of CO have been
evaluated extensively in both healthy and high-risk individuals (WHO
1999; EPA 2000); however, only the studies that are most relevant to the
safety of submarine crew members (healthy adult males) are discussed
here. Table 4-2
summarizes the relevant experimental studies in humans. Chiodi et al.
(1941) conducted controlled exposure studies in which four male subjects
were exposed to CO at 1,500-3,500 ppm repeatedly for durations of 70
minutes (min) or longer. The subjects had COHb concentrations at up to
52%. There were no adverse effects on basal oxygen consumption,
ventilation, pulse rate, blood pressure, or arterial blood pH in that
study. The only adverse effect
TABLE 4-2 Human Toxicity Summary
Concentration (ppm)
|
Exposure Duration
|
COHb %
|
Number of Subjects
|
Effects
|
Reference
|
NS
|
NS
|
NS
|
NS
|
Linear relationship described betweendecline in VO2-max and increasing COHb2
|
EPA 1979; Horvath 1981
|
NS
|
NS
|
4.5
|
NS
|
Decrements in brightness discrimination in trained subjects
|
MacFarland et al. 1944
|
NS
|
NS
|
6-7
|
50
|
Deficit in “careful driving” skills
|
Wright et al. 1973
|
NS
|
NS
|
8-12
|
20
|
No adverse effects on visual discrimination or depth perception
|
Ramsey 1973
|
NS
|
NS
|
9
|
18
|
No decrement in night vision
|
Luria and McKay 1979
|
NS
|
NS
|
10 and higher
|
3
|
Increased reaction time; decreased precisionin maintenance of separation distance between cars; decrease in estimation of time
|
Ray and Rockwell 1970
|
700
|
Time needed to reach target COHb
|
11 and 17
|
27
|
Driving not “seriously” affected; statistically significant increase in roadway viewing time
|
MacFarland 1973
|
100
|
NS
|
0-20
|
49
|
Numbers of errors and completion time
increased with increasing COHb concentrations for several but not all
tests of cognitive ability beginning at COHb concentrations <5 at="" cohb="" concentrations="" no="" occurred="" p="" ptoms="" subjective="" sym="">
|
Schulte 1963
|
NS
|
NS
|
40-45
|
4
|
Inability to perform tasks requiring minimal exertion
|
Chiodi et al. 1941
|
NS
|
5-60 min
|
15-20
|
NS
|
Oxygen uptake in tissues unchanged during submaximal exercise
|
Chevalier et al. 1966; Pirnay et al. 1971; Vogel et al. 1972
|
NS
|
15 min
|
~5-21
|
5
|
Maximal physical performance was reduced with increasing concentrations of COHb
|
Ekblom and Huot
1972
|
300
|
45 min
|
~5
|
20
|
Increased reaction time to visual stimuli; light detection sensitivity and depth perception unaffected
|
Ramsey 1972
|
50
|
1 h
|
2.1
|
9
|
“No untoward subjective symptoms or objective signs of illness”
|
Stewart et al. 1970
|
100
|
1 h
|
~2.5
|
10
|
“No untoward subjective symptoms or objective signs of illness”
|
Stewart et al. 1970
|
~10,000 “booster dose,” 225 maintenance
|
~1 h
|
~18-20
|
8
|
Reduced maximal oxygen uptake; during
submaximal exercise, oxygen delivery to tissues is maintained by
increased cardiac output but smaller arteriovenous oxygen concentration
difference
|
Vogel and Gleser 1972
|
50
|
1.5-2.5 h
|
~2
|
3, 5, or 9, depending on the test
|
Observed impaired vigilance; no effects on response latency, short-term memory, and ability to subtract numbers mentally
|
Beard and Grandstaff 1975
|
250
|
1.5-2.5 h
|
~7
|
3, 5, or 9, depending on the test
|
No effects on vigilance, response latency, short-term memory, and ability to subtract numbers mentally
|
Beard and Grandstaff 1975
|
Concentration (ppm)
|
Exposure Duration
|
COHb %
|
Number of Subjects
|
Effects
|
Reference
|
27-100 to maintain target COHb
|
2 h
|
5, 10, 15, and 20
|
16
|
Cardiovascular system compensated for
reduced oxygen carrying capacity of blood by augmenting heart rate,
cardiac contractility, and cardiac output for submaximal upper and lower
body exercise; compensatory mechanisms began to fail at moderate
exercise and CO exposure
|
Kizakevich et al. 2000
|
11,569 initially, 142 maintenance
|
2.25 h
|
~ 17
|
21
|
Visual function not affected
|
Hudnell and Benignus 1989
|
500
|
2 h-2 h and 20 min
|
~26 (after 2 h and 20 min)
|
6
|
“Increase in heart rate with minimal
exertion;” frontal headaches after 1 hr of exposure; minimal exertion
intensified headache pain; headache pain peaked 3.5 h post-exposure;
changes in visual evoked response at COHb >20%, returned to normal at
COHb <15 p="">
|
Stewart et al. 1970
|
100
|
2.5 h
|
7
|
NS
|
Decrements in two learning tasks; no changes in several other measures of intellectual performance
|
Bender et al. 1971
|
100
|
2.5 h
|
5.7
|
16
|
Increased response times noted in the secondary task of a dual-task procedure in which the primary task was tapping a board
|
Mihevic et al. 1983
|
with a stylus, and the secondary task was announcing or subtracting numbers appearing on a display
|
|||||
0-1,000; gradually rising concentration reached 1,000 after 2 h and was maintained for 30 min
|
2 h 30 min
|
~32 (peak at 2.5 h)
|
2
|
Headaches noted during exposure became
incapacitating 6 h post-exposure and were not ameliorated with a night’s
sleep; clinical chemistries and electrocardiograms remained normal;
changes in visual evoked response at COHb >20%, returned to normal at
COHb <15 and="" coordination="" for="" hand="" impairment="" manual="" noted="" p="" performance="" reaction="" tests="" time="">
|
Stewart et al. 1970
|
2, 50, 100, 200, 500
|
2.5 h
|
Up to 20
|
27 (in groups of 2-8)
|
No impairment in ability to perform time estimation tests
|
Stewart et al. 1973
|
2, 50, 100, 200, 500
|
2.5 h
|
Up to 20
|
27 (3 sessions with 1 subject, 47 sessions with 2-8)
|
Time estimation ability, manual coordination, inspection, and arithmetic performance not impaired
|
Stewart et al. 1975
|
0, 50, 125, 200, 250
|
3 h
|
1, 3, 6.6, 10.4, 12.4
|
10
|
No symptoms and no effects on time
perception and tracking performance; subjects exposed at 200 and 250 ppm
were not blinded regarding exposure
|
Mikulka et al. 1970; O’Donnell et al. 1971
|
Concentration (ppm)
|
Exposure Duration
|
COHb %
|
Number of Subjects
|
Effects
|
Reference
|
5, 35, 70
|
4 h
|
1, 3, 5
|
30
|
Dual-task conditions included
hand-controlled tracking with low- and high-frequency conditions and
monitoring lights and responding with a button press to indicate
brighter lights; differences in tracking performance noted in the 70-ppm
group after 3 h of exposure and in the 35- and 70-ppm exposure groups
after 4 h in the high-frequency condition; reaction times on the light
detection task increased in the 35- and 70- ppm exposure groups in the
final hour of exposure
|
Putz 1979
|
70
|
4 h
|
5
|
12
|
Dual-task conditions as in Putz (1979)
and auditory vigilance; statistically significant differences in
tracking, response time on light monitoring, and auditory vigilance
after 1.5-2 h of exposure
|
Putz et al. 1979
|
200
|
4 h
|
~16 (after 4 h)
|
11
|
Three subjects reported “mild sinus”
headaches in the 4th h; headaches vanished 30 min to 2 h post-exposure;
no impairment of coordination, reaction time, and visual acuity
|
Stewart et al. 1970
|
0, 50, 100, 175, 250
|
4 h
|
NS
|
18
|
Ability to estimate the length of an
auditory signal, compared with a standard signal, reduced at all
CO-exposure concentrations; time to onset of performance deficit
decreased with increasing CO exposure
|
Beard and Wertheim 1967
|
<2 100="" 200="" 500="" 50="" p="">
|
5 h
|
Up to 20
|
27 (in groups of 2-8)
|
No impairment in ability to perform time estimation tests
|
Stewart et al. 1973
|
<2 100="" 200="" 500="" 50="" p="">
|
5 h
|
Up to 20
|
27 (3 sessions with 1 subject, 47 sessions with 2-8)
|
Time estimation ability, manual coordination, inspection, and arithmetic performance not impaired
|
Stewart et al. 1975
|
100
|
8 h
|
11-13
|
2
|
“No impairment”
|
Stewart et al. 1970
|
50
|
24 h
|
~8
|
3
|
“No untoward subjective symptoms or objective signs of illness”
|
Stewart et al. 1970
|
50
|
5 d
|
7
|
15
|
No effects on visual functions
|
Davies et al. 1981
|
0, 15, 50
|
24 h/d, 8 d
|
0.5, 2.4, 7.1
|
30
|
Electrocardiographic P-wave changes in 3 of 15 subjects in 15-ppm group and in 6 of 15 subjects in 50-ppm group
|
Davies and Smith 1980
|
Abbreviations: COHb, carboxyhemoglobin; d, day; h, hour; min, minute; NS, not stated; ppm, parts per million; VO2-max, maximal oxygen consumption.
|
|||||
observed was increased cardiac output (20-50% over baseline) at COHb concentrations greater than 40%.
COHb concentrations at 40% caused drastic
reductions in the ability of subjects to perform tasks requiring even
minimal strength (Chiodi et al. 1941); however, COHb concentrations at
15-20% did not appear to elicit that effect (Chevalier et al. 1966;
Pirnay et al. 1971; Ekblom and Huot 1972; Vogel and Gleser 1972; Vogel
et al. 1972; Kizakevich et al. 2000). Some controlled experimental
studies have found a linear relationship between COHb concentrations at
5-20% and decrements in human exercise performance, measured as maximal
oxygen uptake (EPA 1979, 1984, 1991; Horvath 1981; Shephard 1983, 1984).
However, the decrements were not considered clinically significant.
From a pool of 18 healthy men (24-42 years of
age), Stewart et al. (1970) exposed groups of 2-11 to CO concentrations
ranging from 25 to 1,000 ppm for periods of 30 min to 24 h. The
exposures took place in sedentary exposure chambers. The study
evaluations included measurements of hand and foot reaction time in a
driving simulator, Crawford collar and pin tests, Crawford screw tests, a
hand steadiness test, the Flanagan coordination test, a complete
audiogram, a resting 12-lead electrocardiogram, and measurements of
visual evoked response. CO was well tolerated at concentrations up to
100 ppm (COHb at 12.5%) for up to 8 h, eliciting no subjective signs or
visual or performance impairments. During a 4-h exposure at 200 ppm, 3
of 11 subjects developed mild sinus-like symptoms during the last hour
of exposure when COHb concentrations were their highest (about 16%).
Mild headaches occurred at the end of the first hour of a 2-h exposure
at 500 ppm (COHb at 25.5%) and were followed by excruciatingly severe
occipitofrontal headaches at 3.5 h post-exposure.
Alterations in visual evoked response and other
neurobehavioral end points have been inconsistently reported by
investigators. For example, some studies reported no adverse effects on
vision, visual evoked response, visual discrimination, depth perception,
tracking, or manual coordination in subjects who had COHb
concentrations ranging from 3% to 20% (MacFarland et al. 1944; Stewart
et al. 1970, 1975; Ramsey 1972, 1973; Putz 1979; Putz et al. 1979; Luria
and McKay 1979; Davies et al. 1981; Hudnell and Benignus 1989).
Putz (1979), Putz et al. (1979), and Mihevic et
al. (1983) used dual-task procedures to evaluate neurobehavioral
performance at COHb concentrations up to 5.7% for exposure durations of
2.5-4 h. The primary manual tasks tested were tracking with a hand
control (Putz 1979; Putz et al. 1979), and tapping targets on a board
with a stylus (Mihevic et al. 1983). Second-
ary tasks were detecting light brightness and
responding with a button press (Putz 1979; Putz et al. 1979) and “digit
manipulation” that entailed calling out a number on a display or calling
out the result of subtracting the number from 100 (Mihevic et al.
1983). In all three studies, the reaction times for the secondary tasks
increased after exposure. For example, in Putz (1979) and Putz et al.
(1979), reaction times for the highest-exposure condition increased
about 70-80 milliseconds. The potential adverse effects described by
Putz (1979), Putz et al. (1979), and Mihevic et al. (1983) were
considered clinically insignificant.
Beard and Wertheim (1967) reported decrements in
time-estimation ability in a study of 18 subjects exposed to CO at 0,
50, 100, 175, and 250 ppm for 4 h. The authors saw a dose-dependent
decrease in correct responses. Decrements occurred within 25 min of
exposure at 250 ppm, within 30 min of exposure at 175 ppm, within 50 min
of exposure at 100 ppm, and within 90 min of exposure at 50 ppm (Beard
and Wertheim 1967). COHb concentrations were not reported; however, on
the basis of Figure 4-1,
4-h exposures at 50, 100, 175, and 250 ppm would result in COHb
concentrations of about 3%, 5%, 8%, and 10%, respectively. In contrast,
Mikulka et al. (1970) and O’Donnell et al. (1971) exposed 10 subjects to
CO at 0, 50, 125, 200, and 250 ppm for 3 h and found no consistent
differences in tracking, time estimation, or the Pensacola Ataxia
Battery at any exposure concentration. COHb concentrations averaged 1%,
3%, 6.6%, 10.4%, and 12.4%, respectively. The authors noted that the
subjects in the 200- and 250-ppm trials were not blinded regarding
exposure (Mikulka et al 1970; O’Donnell et al. 1971). Stewart et al.
(1973, 1975) could not replicate the Beard and Wertheim (1967) findings
using three different time-estimation tasks, including the one employed
by Beard and Wertheim (1967).
Beard and Grandstaff (1975) exposed groups of
three, five, or nine subjects to CO concentrations at 0, 50, 175, and
200 ppm for 2 h. COHb concentrations corresponding to the exposures were
<2 175="" 1975="" 200="" 2="" 5-6="" 50="" 7="" a="" about="" affected="" and="" arousal="" at="" authors="" but="" by="" co.="" co="" concluded="" confounded="" consistently="" contributed="" control="" decrements="" difficulty="" digit="" eard="" effects="" exposure="" found="" grandstaff="" groups="" in="" increased="" interactive="" learning.="" mitigated="" nature="" not="" of="" p="" perception="" perceptual="" performance="" ppm.="" ppm="" problem-solving="" related="" results="" span="" spatial="" task="" tasks.="" tasks="" tests="" that="" the="" time-estimation="" to="" tracking="" vigilance="" were="" which="">
Putz et al. (1979) observed performance
decrements in auditory vigilance after 1.5-2 h exposure to CO at 70 ppm
(COHb at 5%). Christensen et al. (1977) exposed 10 subjects for 2 h
under four conditions: no exposure, exposure to low oxygen (17%),
exposure to CO at 114 ppm, and exposure to CO at 113 ppm in a low-oxygen
environment. The authors noted a vigilance performance deficit under
low-oxygen conditions (0.5% COHb), but they noted no differences from
controls during the CO or CO in low-oxygen exposures. COHb
concentrations during those exposures were 2.5% and 2.6% at 50 min and
4.8% and 5.1% at 120 min, respectively.
CO exposures associated with COHb concentrations
as low as 6% and as high as 17% have been found to affect performance on
driving measures, such as time required to respond to a velocity change
in a lead car, glare recovery, hand steadiness, and roadway viewing
time (Ray and Rockwell 1970; MacFarland 1973; Wright et al. 1973).
However, no serious decrements in driving ability occurred at COHb
concentrations 17% (MacFarland 1973).
CO exposures associated with COHb concentrations
at 7% affected subjects’ ability to learn 10 nonsense syllables and
decreased subjects’ ability to recite a series of digits in reverse
order; however, subjects showed no changes in ability to perform other
tasks involving calculations, analogies, shape selection, dot counting,
and letter recognition (Bender et al. 1971).
Benignus (1994) conducted a meta-analysis of the
neurobehavioral effects of CO exposures that included data from a number
of the studies described above (Ramsey 1973; Stewart et al. 1970, 1973;
Wright et al. 1973; Christensen et al. 1977; Putz et al. 1979). Data on
how CO exposure affected vigilance, reaction time, hand steadiness,
visual threshold, time discrimination, and reasoning were included. The
resulting dose-response curves indicated that COHb concentrations of
18-25% are required to produce 10% deficits in neurobehavioral functions
in healthy, sedentary adults (Benignus 1994).
Davies and Smith (1980) conducted an 18-day
experiment in an enclosed environment where 8 days of exposure were
preceded by a 5-day control period and followed by a 5-day recovery
period. Fifteen naval serviceman were exposed to CO at 15 ppm, another
15 were exposed to CO at 50 ppm, and 14 servicemen served as controls.
The mean COHb concentrations in the 15- and 50-ppm exposure groups were
2.4% and 7.1%, respectively. Electrocardiographic P-wave changes greater
than 0.1 millivolts (mV) were observed in 3 of the 15 subjects exposed
to CO at 15 ppm and in 6 of the 15 subjects exposed to CO at 50 ppm
after 2 days of expo-
Comments
Post a Comment